Chart
We use the eCharts charting engine to generate Stadium Charts. Go here for examples of charts that can be used in Stadium.
How to create a Stadium chart
- Drag a Chart control onto the design canvas.
- In the Properties section, click on the Chart Editor icon (next to the Option field).
- Create your chart:
Options -
- Type the code for an eChart compliant chart in the Chart Editor.
OR - Click the relevant link in the Chart Editor to generate a basic line, column or pie chart.
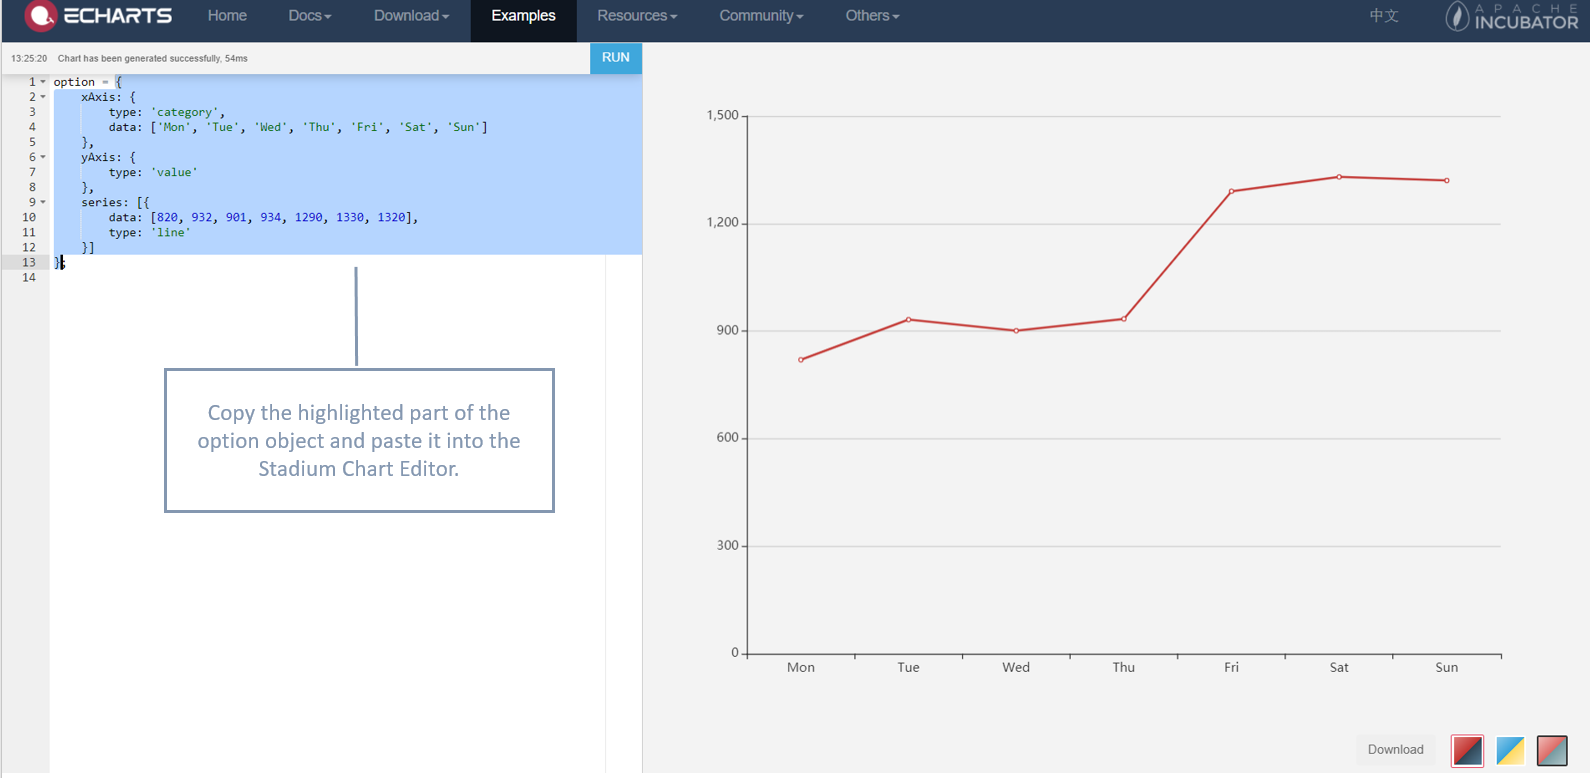
OR - Paste the option object of a chart that you created on
eCharts into the Chart Editor.
- For this option, do the following:
- On the eCharts examples page, click on the chart that you want to use, e.g. Basic Line Chart.
- Copy the chart's option object and paste it into the Stadium Chart Editor.
- Type the code for an eChart compliant chart in the Chart Editor.
How to load data from a database into your chart
- Create your chart as per the steps above, but don't provide values for the source in the object option, i.e. source: []
- Add a database connector and create a SQL query to fetch your data.
- Add your SQL query to the event handler that will load your chart with data (e.g. a page load or button click).
- Add a SetValue action to the event handler:
- Set the Target property to be your chart's option object
- Set the Value property to be the same content as your chart's option object, but now include the source value to reference your SQL query (e.g. source: ~.northwind_Query1.Results)