Data Grid
A Data Grid should be used to display tabular data. In order to use a Data Grid, you need to create a connection and a query and capture these in the Data Grid properties panel.
Add a Data Grid
Data Grid Properties
Columns
Define the columns of the Data Grid. The tabular data of the Data Grid will be shown in these columns.Allow Export
When this is on, users will see an export link that exports all data returned by the query to a Comma-separated values (CSV) file. The file will usually open in Excel by default.Display Search Bar
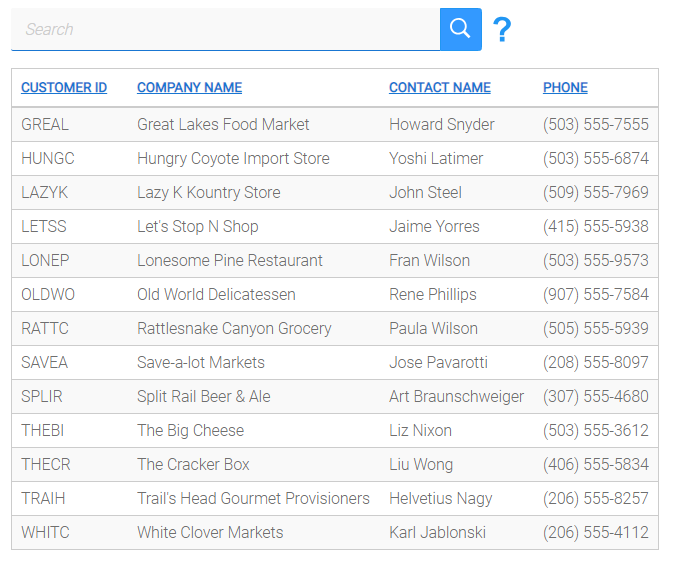
Adds a search bar as shown below.
Selectable Data
Check this if you want to allow users the ability to select one or more rows in the Data Grid. Use a ForEach action in a script to iterate over either all rows or only the selected rows and action them one by one.Visible
Set to False if you don't want this control to render on the page and be visible to the user.
Data Grid Column
Data Grid Columns can be managed by making use of the Columns Editor. This can be opened by clicking on the image to the right of the Columns property on the Data Grid.Data Grid Column Properties
Name
The column name. When assigning data to the Data Grid, this name will be used to auto-match any columns found in the data. This can be overridden at the point where the data is assigned.Column Type
This can be either Data-Bound or Static Text. Data-Bound will retrieve the text for that column for each row from the data assigned to the Data Grid. Static Text will allow the designer to specify the text that will be displayed for that column on each row of the Data Grid (see the property Text).Text
The text that will be repeated for that column on each row of the Data Grid. This is only available to edit if the Column Type was set to Static TextHeader Text
The text that will be displayed in the header for that column.Alignment
Where to align the cell data.Cell Display
There are three modes of cell data display.-
Default
The cell data will not be formatted in any particular way. It will display as it comes from the database and will push the table out to fit the data. -
Wrap
The cell data will be wrapped. Use this option when your data could be quite big, but you don't want to push out the table vertically, but you are happy to push it out horizontally to accommodate the data. -
Elipsis
The cell data will be cut off and the complete cell data will be shown in a tooltip. Use this option when you want your table to remain a specific size.
-
Default
Visible
This flag shows or hides the column.
Assigning data to a Data Grid
Example:
To display a Data Grid containing columns with values retrieved by a SQL query:
- Open the Data Grid's Columns Editor.
- Select from the Add connector fields dropdown list the query that retrieves the data that must be displayed in the Data Grid.
- Select an appropriate Event, e.g. Load (page) or Click (button).
- Drag-and-drop your SQL query onto the main canvas to become part of your selected event's Event Handler.
- Add a SetValue action to your Event Handler to assign the values from the query to the Data Grid's Data property.
Retrieving data from a Data Grid
Properties that can contain data:
- Columns (Text)
Use an action to capture the values from the control. Go here for more details on how to collect data from controls.
Data Grid Column Events
Click
An event that triggers when the text for a column in a row has been clicked.Event Input Parameters:
- Clicked Row
This will contain the entire rows data for the row that was clicked.
- Clicked Row
Data Grid Search
Go here for help on the Data Grid search feature.