A picture is worth a million words! This is a well-known adage very applicable to charts. Charts are an essential part in determining trends, relationships and patterns in data. Without charts, finding these patterns can become tricky and time-consuming. As a result of this, we saw charts, or the visualization of your data, as an essential control in Stadium.
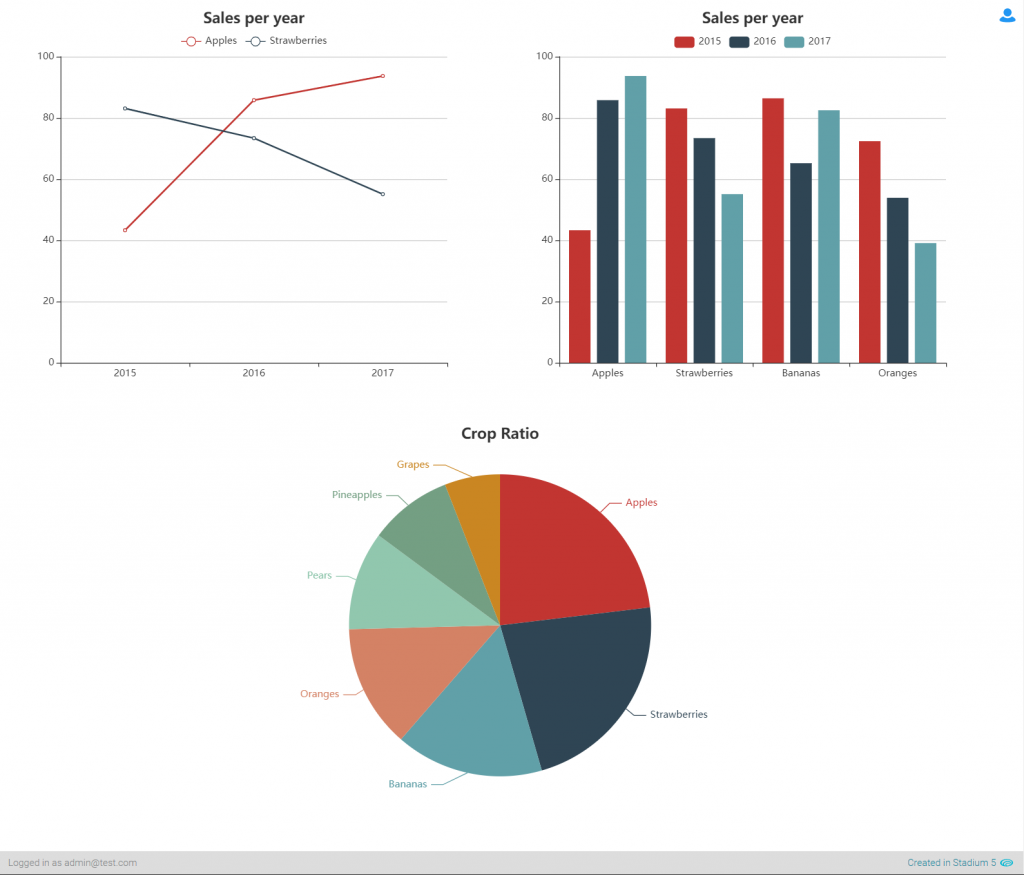
Below you can see the Stadium Chart Control in action:

Up until now Stadium had no concept of secrets and everything was stored iStadium’s Chart control is easy to use, versatile and powerful thanks to the eCharts library it uses under the hood. eCharts provides you with a huge selection of chart types as well as the ability to modify almost anything of the chart itself – change the style of the legend, how tooltips are shown, and countless other things. All of this is done via the javascript object, ‘option’, defined by eCharts. This very option object is what you assign to the Stadium Chart control thereby allowing you all the versatility and power eCharts has to offer. Look through the rich library of examples as well as the detailed eCharts documentation to see for yourself what is possible in eCharts.
For a quick overview on chart terminology and chart types, see the eCharts cheat sheet.
For more on the Chart control in Stadium, see our documentation.
